How do binaural beats work? For that matter, what are binaural beats? Do you know…
The Science Behind Binaural Beats and Isochronic Tones (2024)
David & Steve Gordon recently did a project in collaboration with SongRest. It derives from the science behind binaural beats and isochronic tones.
If you would like to know what are binaural beats and how do they work then first start with this introductory article.
SongRest’s goal on this project was very specific; to incorporate binaural beats and tones with music tracks created by David & Steve Gordon’s Binaural Beats Research. (See this article about those recordings.)
Using tones and beats that match various brainwave bands, we’ve created a variety of different effects for the listener.
The nature of both the music itself and the brainwave frequencies involved affects the final listening experience.
In this music, we use Hz to stand for a single vibration or cycle per second.
How Our Brains Respond to Rhythms and Beats in Music
Any time we follow a musical rhythm or beat with focused attention, something called auditory evoked potential is created in the brain. This is measurable over most of the brain.
Brainwaves result whenever these evoked potentials repeat in rhythm in the music.
Within this collection, the auditory beats “communicate” with our brainwaves via binaural beats and isochronic tones. This communication results in potentially guiding our mental activity in new directions.
These brainwaves associated with any given brain activities won’t be precisely the same for everyone. They vary from person to person based on a variety of factors.
The brainwaves fall into frequency groups called bands.
Brainwave Sleep Music & Sleep Tones
Another application of the science behind binaural beats is the creation of sleep music.
Most people tend to generate strong slow brainwaves while sleeping, falling anywhere between .5Hz and 4Hz depending on the individual.
Every brain is different; therefore, the pulse frequency varies for each person’s brain activity.
The signal may be weak; however, the involvement of enough neurons throughout multiple brain layers makes them measurable at the surface of the head. This measurement is via electroencephalograph, or EEG.
Brainwave Bands & Brain Activities
With these recordings, we identified brainwave bands related to different brain activities. We then selected brainwave bands for each track.
In this way, the music will provide potential benefits to the listener, all while applying the science behind binaural beats.
Here are the standard frequency bands used:
Delta .5Hz to 4Hz, the frequencies of deep sleep
Theta 4Hz to 7.5Hz, the frequencies of meditation, relaxation, drowsiness
Alpha 7.5Hz to 12Hz, pure alertness but not with analytic or executive thought
Beta 12Hz to 38Hz, totally alert, focused and attentive with active analytical and executive thinking
Gamma 38Hz to 90Hz. Where thought patterns are widely structured and static (in a rut), gamma disrupts the coordination between brain areas. This allows for new thinking and creativity
Exploring the Science Behind Binaural Beats & Isochronic Tones
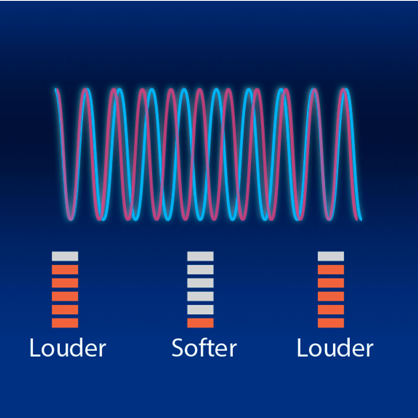
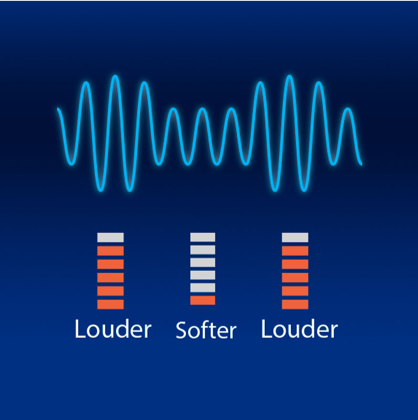
The binaural beats pictured here result from an audio illusion created by the brain when two different tones, close in pitch, are played at the same volume, one in each ear.
The beat frequency results from the difference in the frequency of the two tones.
Note the nature of a binaural beat when the tones alternately reinforce one another. They’re louder near the ends, and cancel one another out, being softer, in the middle.
Imaginary Middle Tone?
Here is another example of the science behind binaural beats in brainwave music.
Normally, the carrier tone, when creating binaural beats, is considered to be a tone somewhere between the higher and lower of the two constituent tones.
For example, if 100Hz and 90Hz are used to create a 10Hz binaural beat, the theoretical carrier is 95Hz, falling halfway between them.
The perceived middle tone is essentially anecdotal.
The relative pitches and distances between the tones affect the resulting middle tone. Therefore, its perception by the listener is inconsistent.
Another SongRest Application of the Science Behind Binaural Beats
For our purposes at SongRest, we did away the notion of the carrier tone being theoretically anywhere.
Rather, the carrier tone is the same as the key or the perfect fifth of the key of the music.
The key of the music will override any theoretical middle tone, since the tones are perceived in the music bed.
We wanted to create a consistent experience in this collection. Thus, we decided to serve the carrier tone to the left ear and the right ear is served the interference tone.
Visualization of Beats & Tones
The isochronic tones you see on the right are pure tones that pulse in volume. They grow louder and softer in a steady tempo.
This image is an example of an isochronic tone.
The frequency matches the number of wave lengths per second while the loudness is shown by the wave height.
The isochronic tone gets louder and softer at the same frequency as the binaural beats’ interference pulses.
The SongRest Experimental Standards Approach
Our approach at SongRest is significantly different from many experimental standards.
Binaural Beats Science In Music for Chronic Pain
The SongRest algorithm, designed for SongRest’s research into music for chronic pain, helped us to tune brainwave frequencies precisely to the key and notes in the music.
We started with the music key, then evaluated the primary tones heard in a given piece along with the desired brainwave band.
Then, we proceeded with the following steps:
- Calculated the note frequencies and harmonics falling in the frequency band, or were simple fractions or multiples of values in the frequency band.
- Determined the minimum frequency of notes necessary to create the binaural beat, using Oster’s Curve as a guide to proportions. We do not rely on Oster’s absolute frequency values since they often are not practical in music.
- Created the interference tone and carrier tone for the beat.
- Used the binaural beat carrier tone as a potential carrier for the isochronic beat.
- Tested and refined as needed.
The SongRest Algorithm
Another aim was to connect the brainwave frequencies closely within the music. To this end, SongRest created an algorithm to match brainwaves to music to relieve pain. We then applied that algorithm to this music.
With the mathematical relationships between the brainwaves and the music, the music holds tremendous potential for brain entrainment to the brainwave frequencies assigned to each piece of music.
Binaural Beat Science and Brainwaves
Using frequency bands that are generally balanced, with no fewer than four pieces per band, we’ve created a comprehensive and powerful brainwave collection.
K = key frequency (root note hz)
Ka= K adjusted to a harmonic of f, namely an integer multiple or fraction, harmonic or subharmonic).
T = tempo in Hz = BPM/60
Ta = tempo adjusted to allow brainwave mapping
f = target entrainment frequency
λ= multiplier based on key frequency
BBc= binaural beat carrier frequency
BBi= binaural beat interference frequency
ε = isochronic carrier
Formula: Where f α Ka α Ta, BBc = Ka ( λ), BBi = BBc– f, ε = Ka x λ α (f)
Here is a description of the formula:
When the target frequency is in proportion with the adjusted frequency as well as the adjusted tempo, the binaural beat carrier is the adjusted frequency times a multiplier.
The multiplier can be a whole number. If so, the carrier is a mathematical harmonic of the key. Or it might be a fraction.
If the multiplier is a fraction, the carrier is a lower tone, a subharmonic.
Subtract the target frequency, f, from the carrier tone, arriving at the interference tone frequency.
The complications are in notes matching the chromatic scale with frequencies in the brainwave bands.
Further Illustration of the Science Behind Binaural Beats
The image you see below is a modified image from music editing software. In it, you can see how closely the volume of the tones follows the music.
This image depicts only the last 25% of the music. You can only imagine the large amount of work involved in adjusting and matching the tones throughout each entire piece.
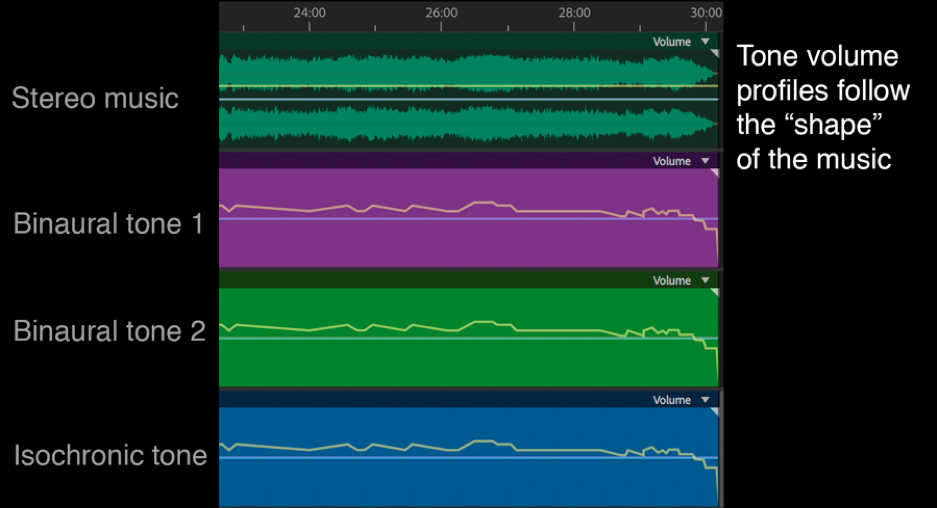
The teal green in this image depicts the original music. You’ll see the “carrier” tone of the binaural beat in purple. This foundation tone matches the key of the music.
Sound and Volume Adjustments
We’ve calibrated the volume of the tones so that they follow every nuance of the music’s volume. The tones remain just in the audible range.
Our sound adjustments took into consideration the fact that some instruments and frequencies sound louder than others at a given volume.
Unlike an automated process, pitch, tonal quality, and other musical aspects, as well as qualities of sound of the beats and tones, factored into volume adjustment.
To obtain precision when matching volume, SongRest used both the music editor interface as well as direct editing of XML code.
Because everyone is different, individuals will hear some tones more audibly than others.
That said, we worked hard to ensure that this music is a valuable tool for relaxation and transformation for everybody.
The work done by SongRest and David & Steve Gordon is another fine example of the science behind binaural beats and isochronic tones in music.
Tools and Methods
Hardward & Software
We used Adobe Audition CC 2018, a professional DAW (digital audio workstation) package designed for editing music. It was our primary tool for sound design.
With this tool, we were able to change the tempo and frequency of music tracks independently and with precision (to 1/100Hz); also without degradation of sound quality.
DAW also generates pure tones for binaural beats.
The Audition program was also used to create the binaural beat tones as separate files and import and align them with the music.
We used a free program called Audacity 2.13, along with a plugin called Isomod, to generate isochronic tones.
Both programs, Audition and Audacity, run on Macintosh as well as Windows operating systems.
To avoid losing any editing quality in the musical output, it generated a .wav or .aiff file.
The software for this project ran on Macintosh OSX 10.13.2 (High Sierra) on a MacBook Pro with a 2.9GHz Intel i7 processor (four cores) and 16GB RAM. The drive is a 500GB flash drive.
Handling of Large Music Files During Development
These were large music files having used sound files at full uncompressed quality. With music averaging 30 minutes per selection, the final mixed music file averaged 1GB in size.
Managing Technical Limitations
We managed to get around one minor technical limitation with the Audacity Isomod plugin. We did so by creating pure tones and isochronic beat profiles at a fraction of the intended frequencies.
Using these smaller frequencies maintained an accuracy of .001Hz, reducing errors when scaled to 2-3 times the original frequency.
By scaling the duration of the clips to match the exact requirements of the music, we were able to increase the frequencies in Audition.
This methodology meant that careful calculation and exacting placement of the tones with the music was critical.
These calculations involved zooming in to extreme levels as shown. We also edited by fractions of a cycle to exactly match the tones generated with those of the music.
In this waveform image, you’ll see how we matched the wave peaks of the binaural beat carrier tone (293.67Hz, the D just above middle C), the BB low tone of 244.725Hz (close, but not exactly a half-step lower), with the center of the isochronic pulse, all done via manual alignment.
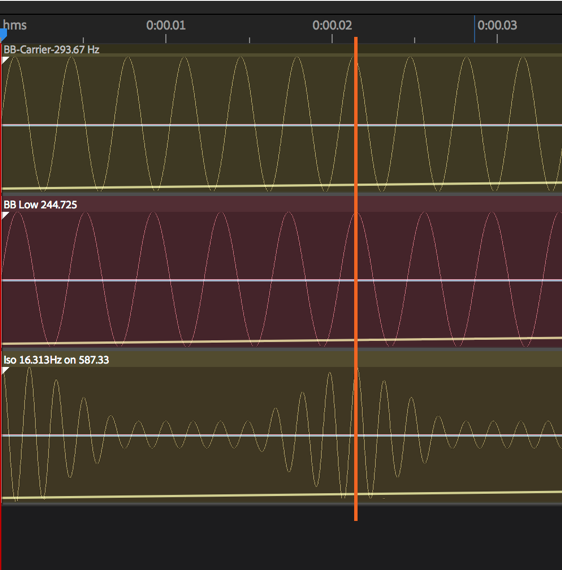
In this piece, the isochronic pulse pulsed at 16.33Hz on a baseline tone of 587.33Hz; D an octave above the binaural beat carrier.
The 16.33Hz frequency is 1/36 of its carrier tone; also the note of D, if we were able to hear a sound that low.
The Science Behind Binaural Beats & Pitch And Amplitude
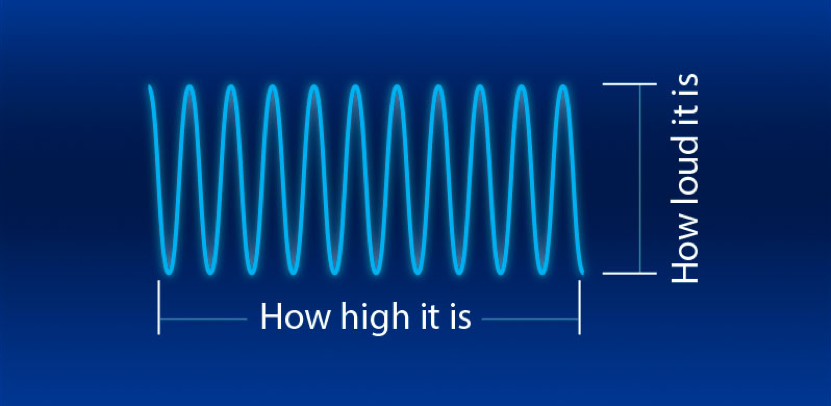
Two fundamental factors come into play when dealing with sound. These are pitch and amplitude.
Pitch is how high the sound is, based on the number of waves per second, or the frequency.
The relative height of the waves to each other is how loud it is, or the amplitude.
How We Deviate From the Usual Research Practices
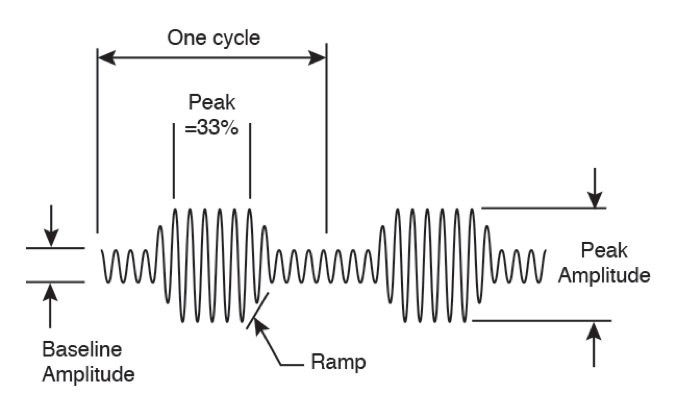
SongRest deviates from the usual practice done in research conditions in their isochronic tone production.
Usually, the isochronic tone pulses between silence and on, and to avoid a “click” effect in the music, the tone pulse is ramped up and down.
What SongRest has done is set a still audible baseline level amplitude for the tone. At the beginning and end of each pulse, the amplitude ramps up and down.
In this way, the peak amplitude lasts for 33% of the time between pulses wherever possible.
You’ll see this design below.
A Major Breakthrough – Listen in Headphones, Ear Buds or Speakers
There are two reasons we use binaural beats plus isochronic tones. First, the music experience is significantly improved because the two modes enhance one another.
The second reason is to enhance the listening experience through speakers, where the isochronic tone pulses may be more audible than the binaural beats.
Even with stereo separation, because the binaural beats function as monaural beats so that both ears hear both tones, the listening experience remains exceptional.
The selected tones and beats are based on the illustrated standards.
Historical Note on Brainwave Bands
No one would fault you for thinking that brainwave frequencies are listed in order of the Greek alphabet (alpha, beta, gamma, delta, etc.) It only makes sense, after all.
However, because brainwave frequencies were discovered at different times, their names are not in a nicely ascending order of the Greek alphabet.
Instead their names are based on when they were discovered, as shown below:
- alpha (7-12Hz) and beta (12-38Hz), discovered by Hans Berger, the inventor of the electroencephalograph, or EEG, in 1924
- Delta waves (.5-4Hz), discovered by W. Grey Walter, 1930s, who improved the EEG.
- Theta (4Hz-7.5Hz), identified by Jung and Kornmüller in the 1930s and clarified by John D. Green and Arnaldo Arduini
- Gamma (38Hz-90Hz), identified by Pheiffer and Smythies in 1964.
The order from lowest to highest frequencies is: Delta, Theta, Alpha, Beta, Gamma.
There is another set of waves called Lambda waves. Unlike most brainwaves, Lambda waves are saw-toothed triangular waves around 200 Hz. Most other waves are smoothly-curving sine waves.
Lambda waves are primarily visual. Gamers produce a lot of them. They’re generally associated with activity of the eyes open. For these reasons, we have not included them in the music.
Hz is named for Heinrich Herz, who first proved the existence of electromagnetic waves such as radio waves, measured in cycles per second.
If you are interested in learning more about the science of binaural beats, explore SongRest’s accompanying article on how binaural beats music works in creating brainwave music.
Click here to listen now on your favorite music service, hear sound samples or to download albums by Binaural Beats Research.
SongRest is an independent non-profit research group founded in 2016 to study neurological principles applied to music for the purpose of relieving pain long-term. Contact the author at music@songrest.com.
Related Posts